
Double: proportions, parity, frequency of numbers and entropy
Read the sample composition indicators and understand what frequency and diversity numbers actually describe.
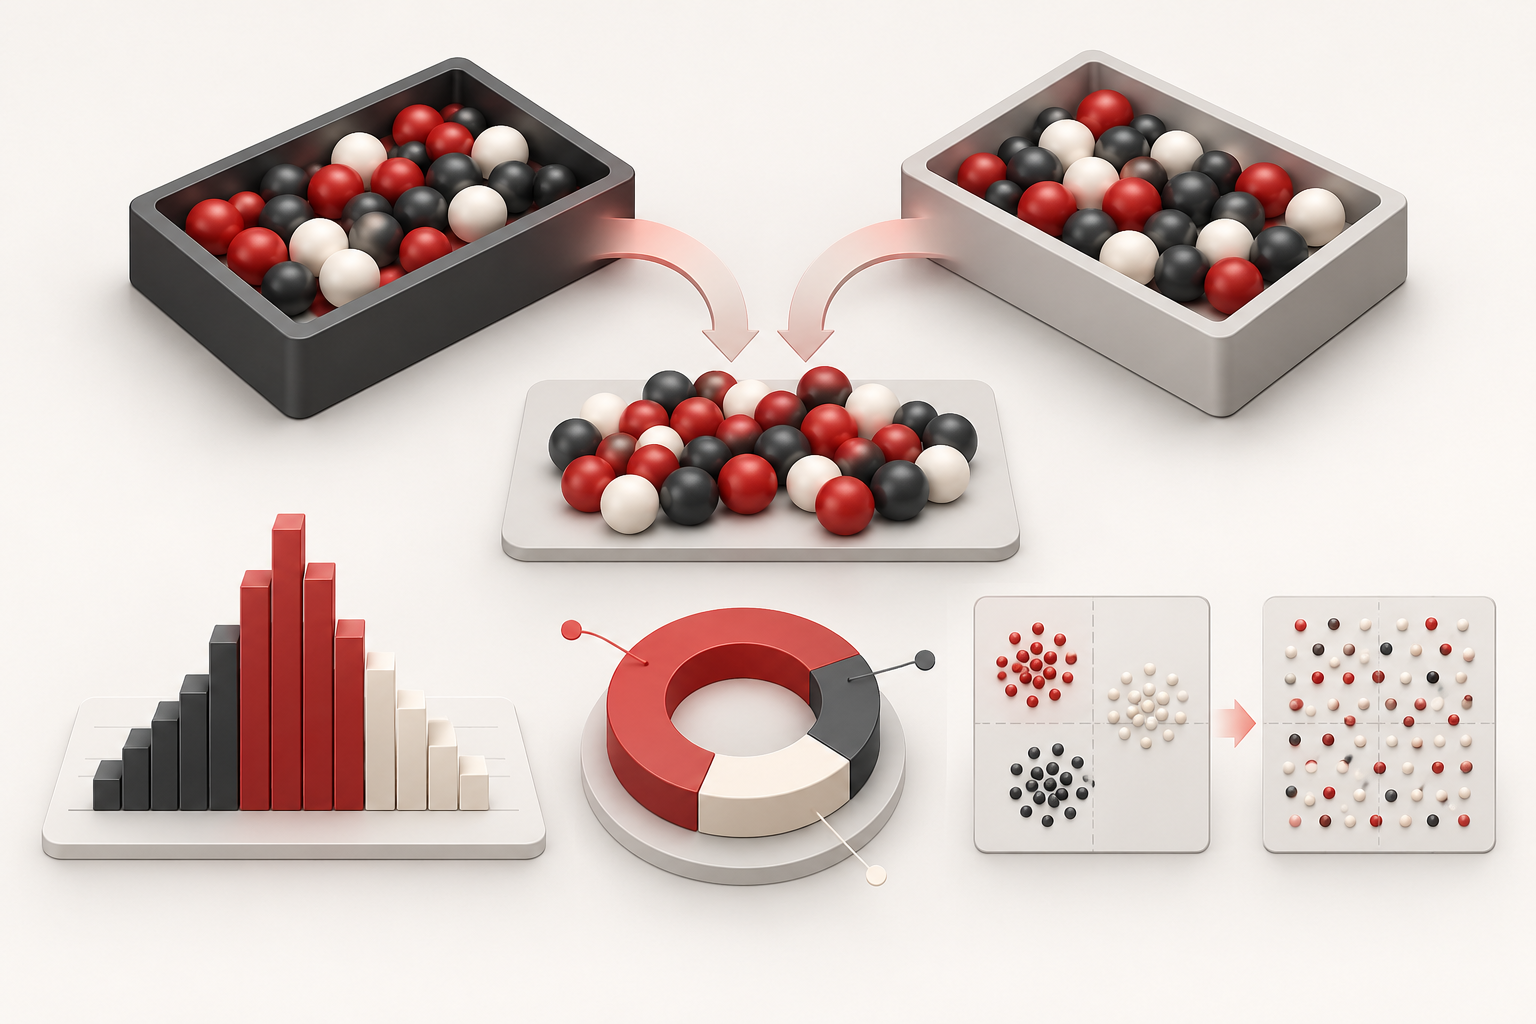
In the Double family screen statistics, different cards summarize the composition of the records. Enter the account, open the section and check the quantity used in the calculation before comparing proportions, numbers and parity.
Start with the counts
A proportion expresses the participation of a group in the analyzed set. In an illustrative sample of 100 records, 45 reds represent 45%. If you filter to keep only reds, this participation fails to describe the original composition.
Frequency and trend panels help you recognize which numbers appeared more or less in the cut. A number with few appearances may simply be underrepresented in this sample. The expression “trend” in the interface does not transform this count into a forecast.
Check the parity rule
The parity report organizes records according to the attribute used by the application. Do not assume that color and parity categories are equivalent. If you need to audit an example, check the record number and classification, including the handling of zero.
To compare two periods, keep discretion and document the size of the sets. Ten records from a group in 20 rounds mean something different than ten in 200.
What entropy measures
The entropy card summarizes the diversity of number frequencies. For 15 possible values, the theoretical maximum reference is approximately 3,906 bits, obtained by log2(15). A very concentrated distribution has lower entropy; a more balanced distribution has greater value.
This measure does not certify randomness or integrity of origin. A constructed sequence may have balanced frequencies, and a small sample may appear concentrated. The bar and its labels are a way of reading the indicator, not a complete test of the results generator. Consult the statistics guide and always compare the measurement with the number of records available.