Short-term Trends: understanding the widget
A practical explanation of the "Short-term Trends" widget: what it indicates, how to interpret signals, limitations and a fictitious example for historical analysis.
What is the "Short-term Trends" widget?
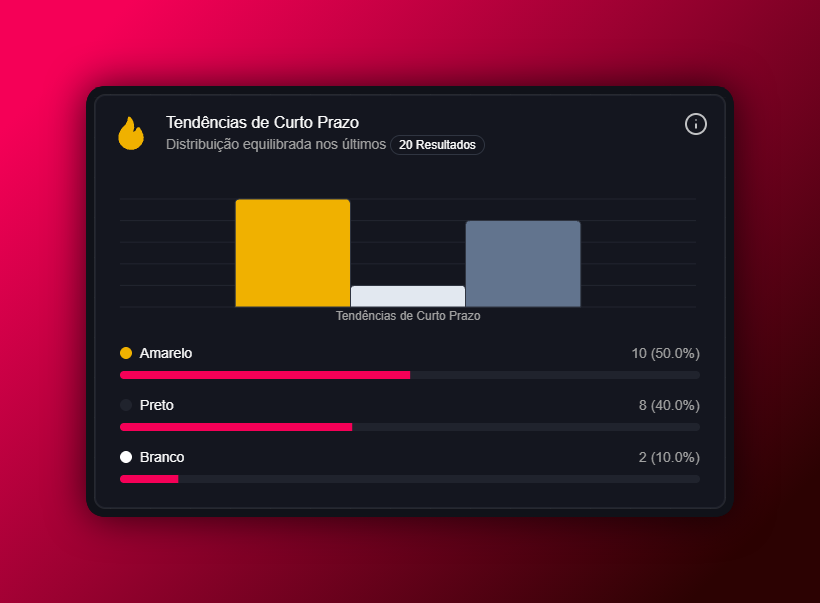
The "Short-term Trends" widget is a visualization tool designed to highlight recent movements within a historical series. It summarizes immediate patterns — for example direction, strength and frequency of changes over short time windows — for users who need to monitor quick shifts. 🔍
Note: according to the owner, Blaze is paused in Brazil.
Typical contents
Without assuming specific features, a widget with this name commonly provides, succinctly:
- An indication of the prevailing direction (up, down, stable) over a short interval.
- Aggregated measures of variation (for example: how often direction changed) or recent event counts.
- A compact chart or visual indicators that make the trend quickly readable. 📈
These elements are visual cues, not guaranteed forecasts.
How to interpret signals
- Treat the widget as a summary: it indicates when deeper analysis may be warranted, not a final decision.
- Check the time window the widget uses (e.g., last minutes, hours, or sessions) before drawing conclusions.
- Combine the widget's reading with other tools on the platform for broader context (volume, longer history, seasonal patterns).
Important limitations
- It does not guarantee outcomes: short-term trends can reverse quickly.
- External causes (news, outages, rule changes) may not be reflected and can produce sudden shifts.
- If the widget aggregates data, be aware of possible update delays: visual widgets may have latency depending on the data source.
Best practices when using the widget
- Use the indicated trend as a starting point for investigation, not as an automatic instruction.
- Confirm signals with data from different windows (short and medium term) to avoid decisions based on noise.
- Do not rely on it as the sole criterion for any action that involves risk; cite other metrics and context.
- Do not recommend or instruct minors to place bets. 🚫👦👧
Fictitious example
Example (fictitious): the widget shows "short-term trend: slight up" over the past 30 minutes. Prudent interpretation: there was a higher frequency of upward results in that period, but without additional information it cannot be assumed this will continue.
Conclusion
The "Short-term Trends" widget is helpful to flag recent movements and guide deeper analysis. Use it as a visual summary, verify with other sources and remain aware of its limitations. ⚖️