
Crash: distribution of multipliers, median, and percentiles
Explore the sample histogram and percentiles, identifying the range limits and the effect of outliers.
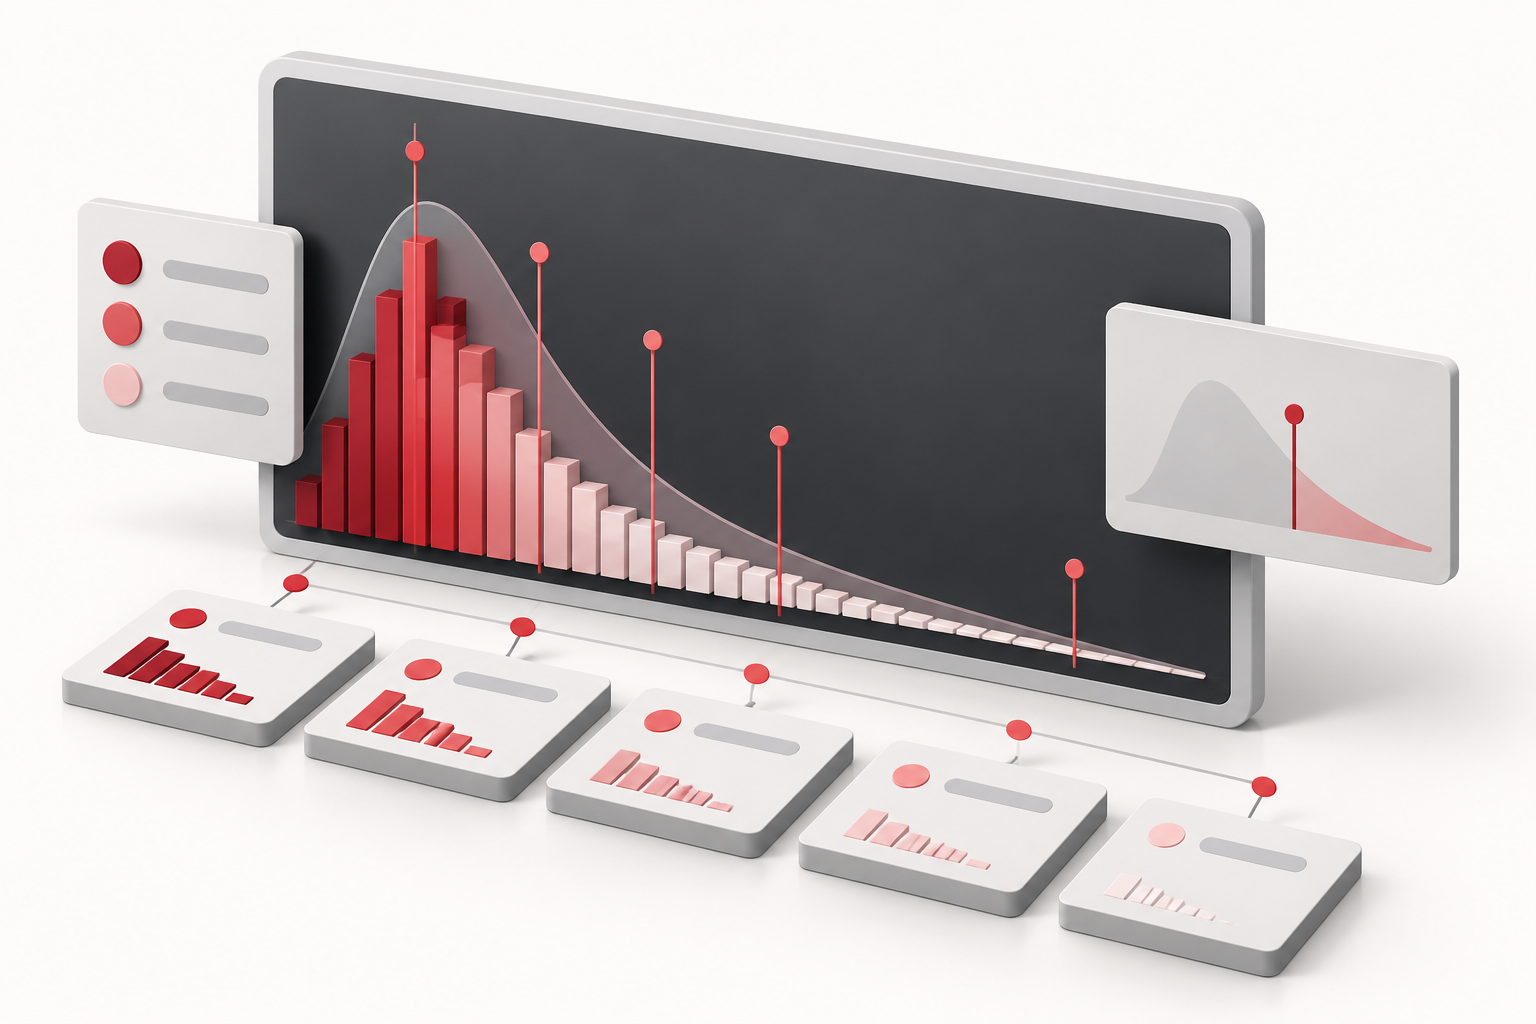
The Crash family histories feature numbers on a different scale from the Double family. To describe them, the statistics section includes multiplier distribution, percentiles, groupings, frequencies, and sequences. Access to the dashboards requires login.
Read the histogram ranges
The distribution card organizes positive and valid numerical values into ranges: below 1.2x; from 1.2x to less than 1.5x; from 1.5x to less than 2x; and so on, up to 20x or more.
The upper limit of the intermediate ranges is exclusive. A record exactly at 2x belongs to the range starting at 2x. The height of the bars makes it easy to compare counts; the percentages indicate participation relative to the values accepted by the card.
Use percentiles to describe the distribution
The median corresponds to the 50th percentile. The panel also shows P75, P90, and P95, calculated with interpolation between ordered positions when necessary. Therefore, a percentile may not match a value that literally appeared in a round.
In an illustrative example with 1, 2, and 9, the median is 2 and the mean is 4. The extreme value affects the mean differently. Comparing measures helps recognize the shape of the set without summarizing everything to the highest multiplier.
Do not mix grouping methods
Other cards display frequencies and groupings with their own rules. Check their labels before summing categories or treating every number as a cumulative count above a limit.
When changing the filter or loading more, review the quantity and period. The observed tail and percentiles belong to the slice, not to a calendar of future results. If you want to compare samples, keep the same criteria and record the context. The statistics guide shows how to open the section corresponding to the game.