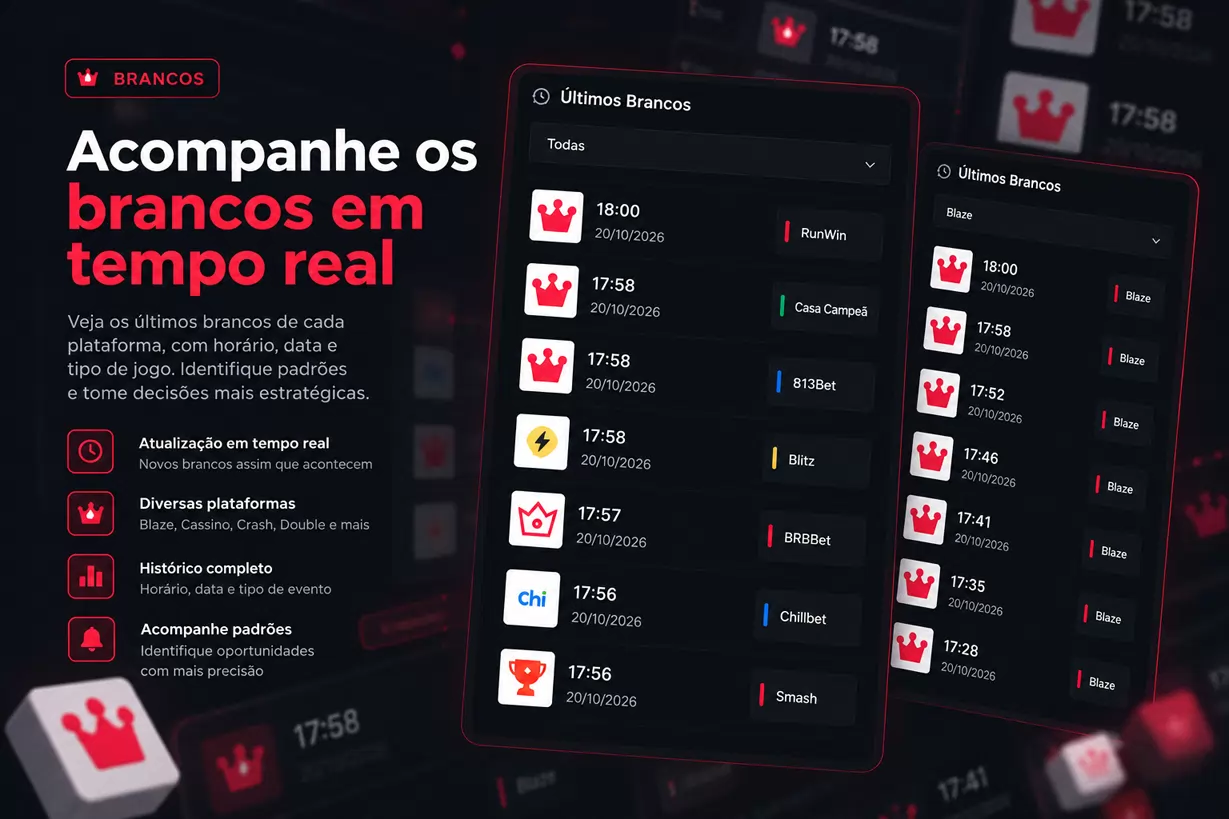
Double Live Chart: Flow, Exposure, and Session Limits
Get to know the indicators on the graph page and differentiate aggregate values received when connecting the balance of a personal account.
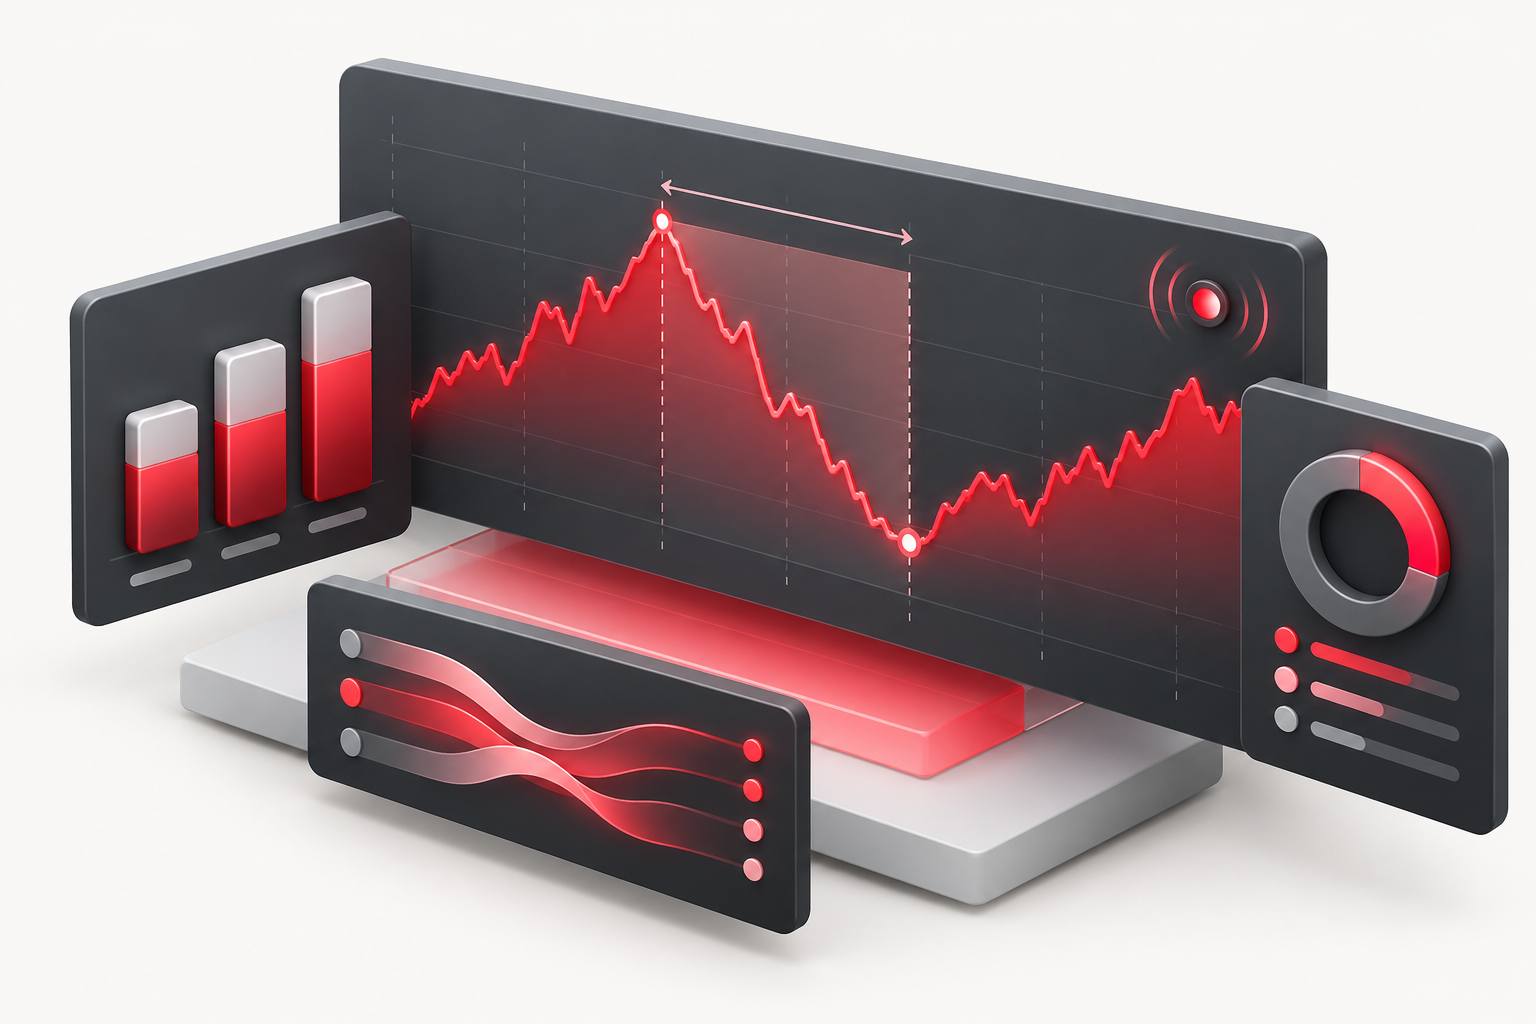
New financial graph: follow the movement of each round
Blaze History gained a new tool to monitor Blitz's Double and Fortune Double: the financial chart with candles, saved history and real-time updates.
In addition to checking the results, you can now view how much was bet, how much was paid and how the house balance changed throughout the rounds.
One round, one candle
Each candle represents a round captured by the system and connects two values:
- Opening: accumulated balance before the round.
- Closing: accumulated balance after the round.
The difference between them corresponds to the house's financial result in that round:
House result = total bet − total paid
When the value is positive, the house received more in bets than it paid in prizes. When it is negative, payouts have exceeded bets.
Candles show this change between opening and closing. They do not represent price fluctuations during the round.
Balance accumulated since the beginning of the day
The graph starts with zero base at 00:00, São Paulo time, and accumulates the results of the rounds captured that day.
You can select a date to view the corresponding history. Each day has its own rollup, making it easy to compare between different sessions.
The balance displayed represents the movement recorded by the system. Any interruptions in collection may leave gaps in the history.
Own colors for each game
In color by result mode, the candles follow the visual identity of each game:
| Double da Blitz | Fortune Double |
|---|---|
| Yellow | Red |
| White | Yellow |
| Black | Purple |
It is also possible to choose the coloring by profit or loss, highlighting the house's financial result in each round.
Betting volume by color
Below the candles, stacked bars show how the stake was distributed among the three colors.
This visualization allows you to compare the movement of rounds and identify where bets were concentrated.
When a round does not have the necessary detail by color, the graph presents its total volume without inventing a distribution.
Drawdown over time
The drawdown panel shows how much the accumulated balance has fallen in relation to the highest value it had already reached that day.
For example: if the balance reached R$10,000 and then dropped to R$7,000, the drawdown at that moment is R$3,000.
In addition to the evolution on the panel, the summary shows the maximum drawdown of the day.
Details of each round
When exploring a candle, you can query:
- Time and result of the round.
- Previous balance and balance after the result.
- Profit or loss of the house.
- Total bet and total paid.
- Number of entries.
- Drawdown at that moment.
The latest rounds table also allows you to quickly access the latest results.
Select a range to analyze
Want to observe just one part of the day? Activate range selection and mark the start and end points on the graph.
The summary brings together the selected rounds and presents their betting values, payments, financial result and drawdown.
You can also adjust the limits using the panel controls. The interval calculation only considers the chosen section; the balance of the candles continues to be referenced to the daily accumulation.
More space and tools to explore
The chart has features to facilitate navigation:
- Full screen: expands the analysis area.
- Zoom: zooms in or out of rounds.
- Fit to content: fits the available candles.
- Last round: returns to the most recent region of the graph.
- Rounded or traditional candles: allows you to choose the presentation.
- Line drawing: Mark two points to create your own visual references.
Lines track time and value during navigation. You can undo or clear the drawings, which are available during the chart session.
Consult previous candles
The chart allows you to expand the history displayed with the “Load previous” button, choosing a quantity between 1 and 1000 candles at a time.
This control cycles through the history of the selected day. To consult another day, change the date in the filter.
Loading previous candles does not reset the balance: the values remain linked to the same daily basis.
Saved history and real-time updates
The rounds are recorded in the history, allowing you to consult the available data even after closing and opening the page.
During the current day, new rounds are added to the chart as they arrive in the system. The connection indicator informs you of the update status, and the update button allows you to request a new synchronization.
Start exploring
The new graphic is available for:
- Double da Blitz
- Fortune Double from Blitz
Log in, choose the day and explore the financial movement of the rounds.
The graph is a historical consultation and analysis tool. The values shown do not allow you to predict the next color or result.